Evaluation metrics
Classification Metrics
Single Metrics
![]() Side Notes : The focus is on binary classification but most scores can be generalized to the multi-class setting. Often this is achieved by only considering "correct class" and "incorrect class" in order to make it a binary classification, then you average (weighted by the proportion of observation in the class) the score for each classes.
Side Notes : The focus is on binary classification but most scores can be generalized to the multi-class setting. Often this is achieved by only considering "correct class" and "incorrect class" in order to make it a binary classification, then you average (weighted by the proportion of observation in the class) the score for each classes.
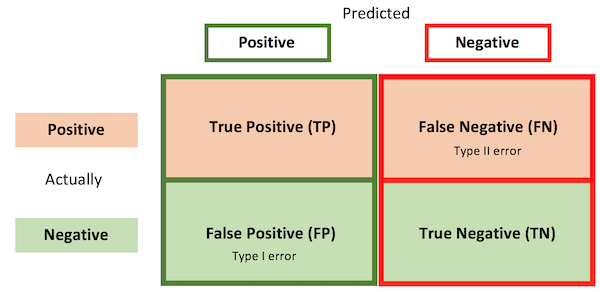
- TP / TN / FN / FP: Best understood through a \(2*2\) confusion matrix.
-
Accuracy: correctly classified fraction of observations.
- $ Acc = \frac{Real Positives}{Total} = \frac{TP+FN}{TP+FN+TN+FP}$
-
 In general, how much can we trust the predictions ?
-
 Use if no class imbalance and cost of error is the same for both types
-
Precision fraction of positive predictions that were actually positive.
- $ Prec = \frac{TP}{Predicted Positives} = \frac{TP}{TP+FP}$
-
How much can we trust positive predictions ?
-
Use if FP are the worst errors
-
Recall fraction of positive observations that have been correctly predicted.
- $ Rec = \frac{TP}{Actual Positives} = \frac{TP}{TP+FN}$
-
How many actual positives will we find?
-
Use if FN are the worst errors
-
F1-Score harmonic mean (good for averaging rates) of recall and precision.
- $F1 = 2 \frac{Precision * Recall}{Precision + Recall}$
- If recall is $\beta$ time more important than precision use $F_{\beta} = (1+\beta^2) \frac{Precision * Recall}{\beta^2 Precision + Recall}$
-
How much to trust our algorithms for the positive class
-
Use if the positive class is the most important one (i.e. want a detector rather than a classifier)
-
Specificity recall for the negative negatives.
- $ Spec = \frac{TN}{Actual Negatives} = \frac{TN}{TN+FP}$
-
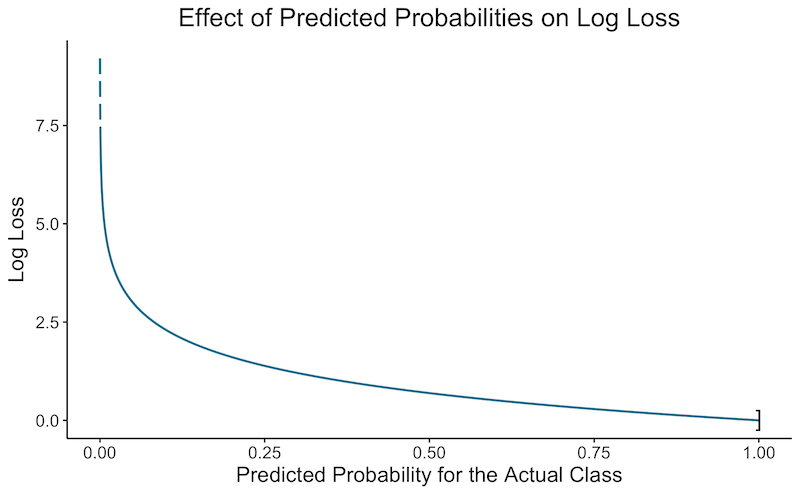
Log-Loss measures performance when model outputs a probability $\hat{y_{ic}}$ that observation $n$ is in class $c$
- Also called Cross entropy loss or logistic loss
- $logLoss = - \frac{1}{N} \sum^N_{n=1} \sum^C_{c=1} y_{nc} \ln(\hat{y}_{nc})$
- Use the natural logarithm for consistency
- Incorporates the idea of probabilistic confidence
- Log Loss is the metric that is minimized through Logistic Regression and more generally Softmax
-
Penalizes more if the model is confident but wrong (see graph below)
-
Log-loss is the cross entropy between the distribution of the true labels and the predictions
-
Use when you are interested in outputting confidence of results
- The graph below shows the log loss depending on the confidence of the algorithm that an observation should be classed in the correct category. For multiple observation we compute the log loss of each and then average them.
-
Cohen's Kappa Improvement of your classifier compared to always guessing the most probable class
- $\kappa = \frac{accuracy - percent_{MaxClass}}{1 - percent_{MaxClass}}$
- Often used to computer inter-rater (e.g. 2 humans) reliability: $\kappa = \frac{p_o- p_e}{1 - p_e}$ where $p_o$ is the observed agreement and $p_e$ is the expected agreement due to chance.
- $ \kappa \leq 1$ (if $<0$ then useless).
-
Accuracy improvement weighted by class imbalance .
-
Use when high class imbalance and all classes are of similar importance
-
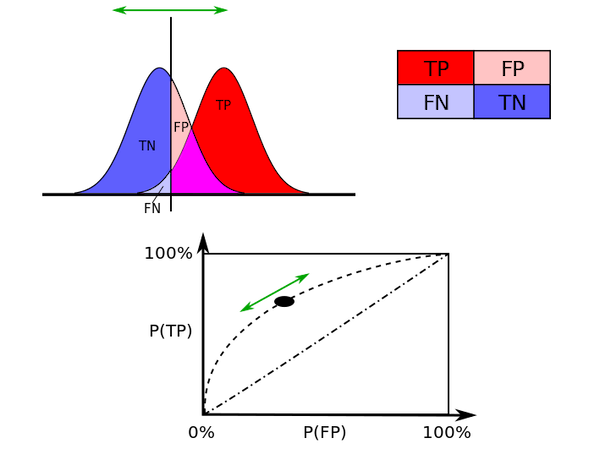
AUC Area Under the Curve. Summarizes curves in a single metric.
- It normally refers to the ROC curve. Can also be used for other curves like the precision-recall one.
-
Probability that a randomly selected positive observation has is predicted with a higher score than a randomly selected negative observation .
-
 AUC evaluates results at all possible cut-off points. It gives better insights about how well the classifier is able to separate between classes . This makes it very different from the other metrics that typically depend on the cut-off threshold (e.g. 0.5 for Logistic Regression).
 -
Use when building a classifier for users that will have different needs (they could tweak the cut-off point) . From my experience AUC is widely used in statistics (~go-to metric in bio-statistics) but less in machine learning.
- Random predictions: $AUC = 0.5$. Perfect predictions: $AUC=1$.
Visual Metrics
-
ROC Curve : Receiver Operating Characteristic
- Plot showing the TP rate vs the FP rate, over a varying threshold.
- This plot from wikipedia shows it well:
-
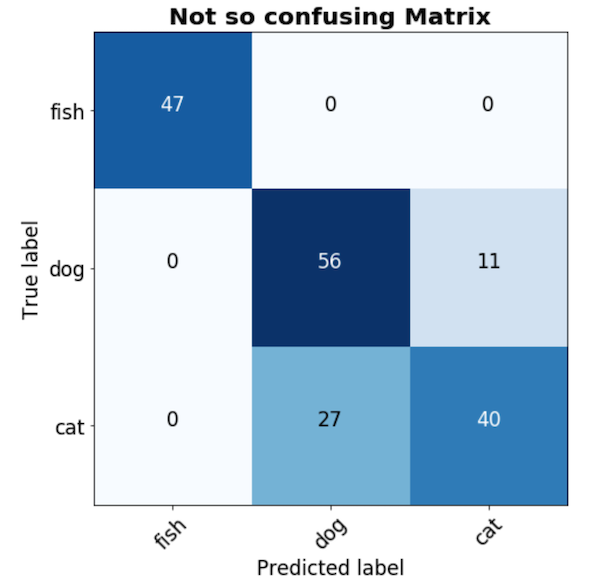
Confusion Matrix a $C*C$ matrix which shows the number of observation of class $c$ that have been labeled $c', \ \forall c=1 \ldots C \text{ and } c'=1\ldots C$
-
Be careful: People are not consistent with the axis :you can find real-predicted and predicted-real .
- Best understood with an example:
-
![]() Resources : Additional scores based on confusion matrix
Resources : Additional scores based on confusion matrix
